Building applications with jupyter-gmaps
- You can use jupyter-gmaps as a component in a Jupyter widgets application. Jupyter widgets let you embed rich user interfaces in Jupyter notebooks. For instance:
- you can use maps as a way to get user input. The drawing layer lets users draw markers, lines or polygons on the map. We can specify arbitrary Python code that runs whenever a shape is added to the map. As an example, we will build an application where, whenever the user places a marker, we retrieve the address of the marker and write it in a text widget.
- you can use maps as a way to display the result of an external computation. For instance, if you have timestamped geographical data (for instance, you have the date and coordinates of a series of events), you can combine a heatmap with a slider to see how events unfold over time.
Reacting to user actions on the map
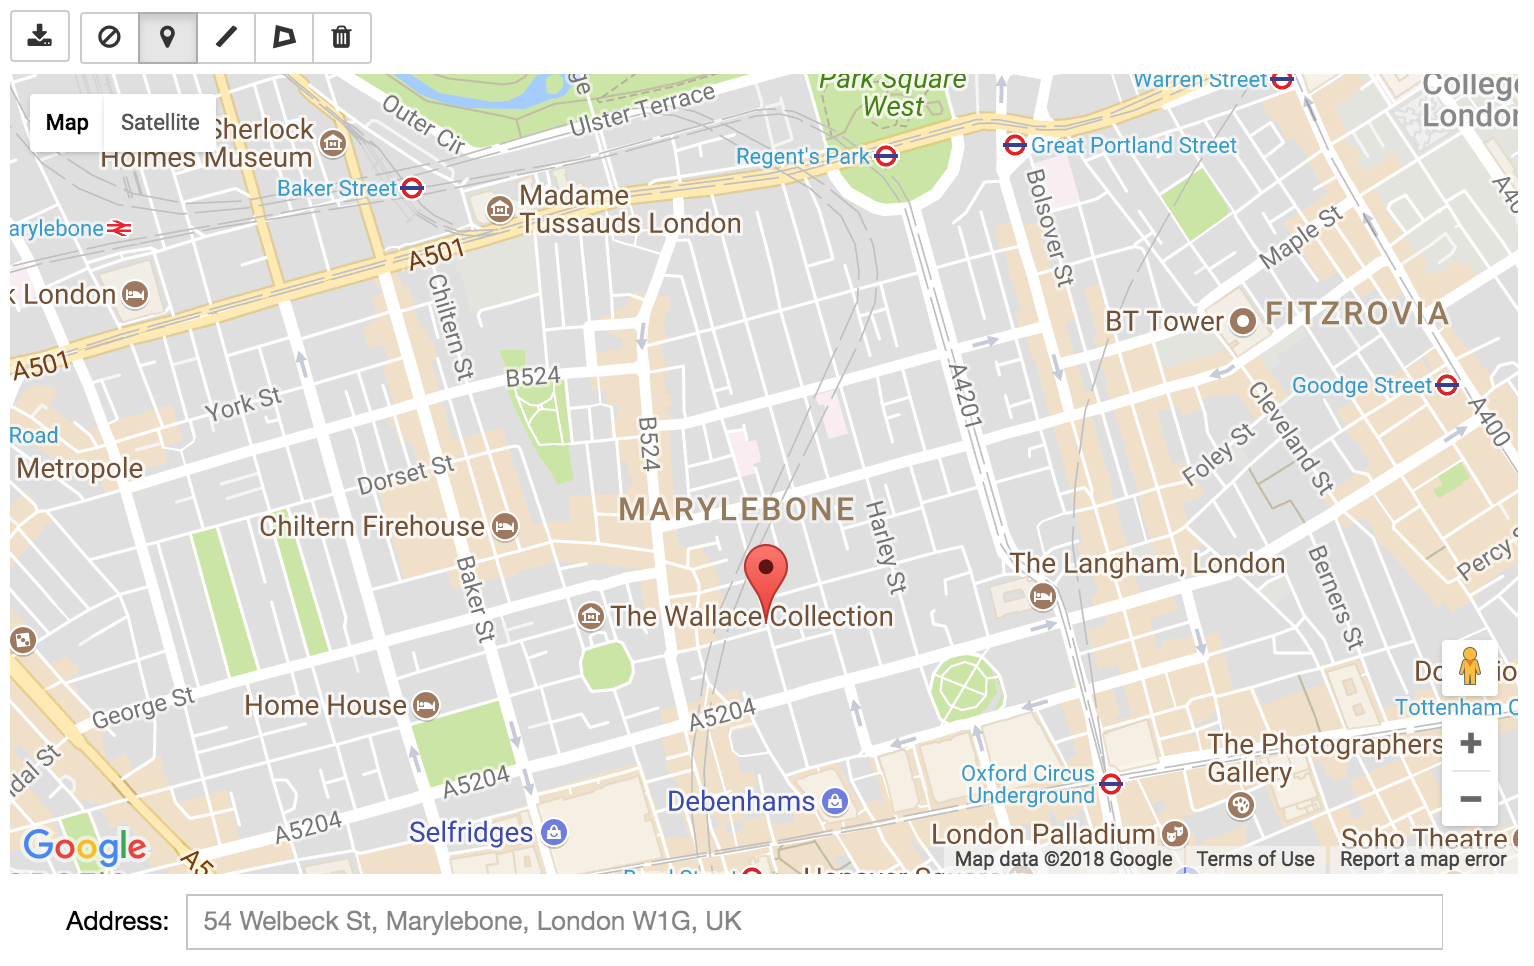
The drawing layer lets us specify Python code to be executed whenever the user adds a feature (like a marker, a line or a polygon) to the map. To demonstrate this, we will build a small application for reverse geocoding: when the user places a marker on the map, we will find the address closest to that marker and write it in a text widget. We will use geopy, a wrapper around several geocoding APIs, to calculate the address from the marker’s coordinates.
This is the entire code listing:
import ipywidgets as widgets
import geopy
import gmaps

API_KEY = 'AIz...'

gmaps.configure(api_key=API_KEY)

class ReverseGeocoder(object):
    """
    Jupyter widget for finding addresses.

    The user places markers on a map. For each marker,
    we use `geopy` to find the nearest address to that
    marker, and write that address in a text box.
    """

    def __init__(self):
        self._figure = gmaps.figure()
        self._drawing = gmaps.drawing_layer()
        self._drawing.on_new_feature(self._new_feature_callback)
        self._figure.add_layer(self._drawing)
        self._address_box = widgets.Text(
            description='Address: ',
            disabled=True,
            layout={'width': '95%', 'margin': '10px 0 0 0'}
        )
        self._geocoder = geopy.geocoders.GoogleV3(api_key=API_KEY)
        self._container = widgets.VBox([self._figure, self._address_box])

    def _get_location_details(self, location):
        return self._geocoder.reverse(location, exactly_one=True)

    def _clear_address_box(self):
        self._address_box.value = ''

    def _show_address(self, location):
        location_details = self._get_location_details(location)
        if location_details is None:
            self._address_box.value = 'No address found'
        else:
            self._address_box.value = location_details.address

    def _new_feature_callback(self, feature):
        try:
            location = feature.location
        except AttributeError:
            return # Not a marker

        # Clear address box to signify to the user that something is happening
        self._clear_address_box()

        # Remove all markers other than the one that has just been added.
        self._drawing.features = [feature]

        # Compute the address and display it
        self._show_address(location)

    def render(self):
        return self._container

ReverseGeocoder().render()
There are several things to note:
- We wrap the application in a
ReverseGeocoderclass. Wrapping your application in a class (rather than using the notebook’s global namespace) helps with encapsulation and lets you instantiate this widget multiple times. Since the flow through widget applications is often more complex than linear data analysis workflows, encapsulation will improve your ability to reason about the code. - As part of the class constructor, we use
gmaps.figure()to create a figure. We then usegmaps.drawing_layer()to create a drawing layer, which we add to the figure. We also create awidgets.Textwidget. This is a text box in which we will write the address. We then wrap our figure and the text box in a singlewidgets.VBox, a widget container that stacks widgets vertically. - We register a callback on the drawing layer using
.on_new_feature. The function that we pass in to.on_new_featurewill get called whenever the user adds a feature to the map. This is the hook that lets us build complex applications on top of the drawing layer: we can run arbitrary Python code when the user adds a marker to the map. - In the
.on_new_featurecallback, we first check whether the feature that has been added is a marker (the user could, in principle, have added another feature type, like a line, to the map). - Assuming the feature is a valid marker, we first clear the text widget containing the address. This gives feedback to the user that something is happening.
- We then re-write the
.featuresarray of the drawing layer, keeping just the marker that the user has just added. This clears previous markers, avoiding clutter on the map. - We then use geopy to find the adddress. Assuming the address is valid, display it in the text widget.
Updating a heatmap in response to other widgets
Many layers support updating the data without re-rendering the entire map. This is useful for exploring multi-dimensional datasets, especially in conjunction with other widgets.
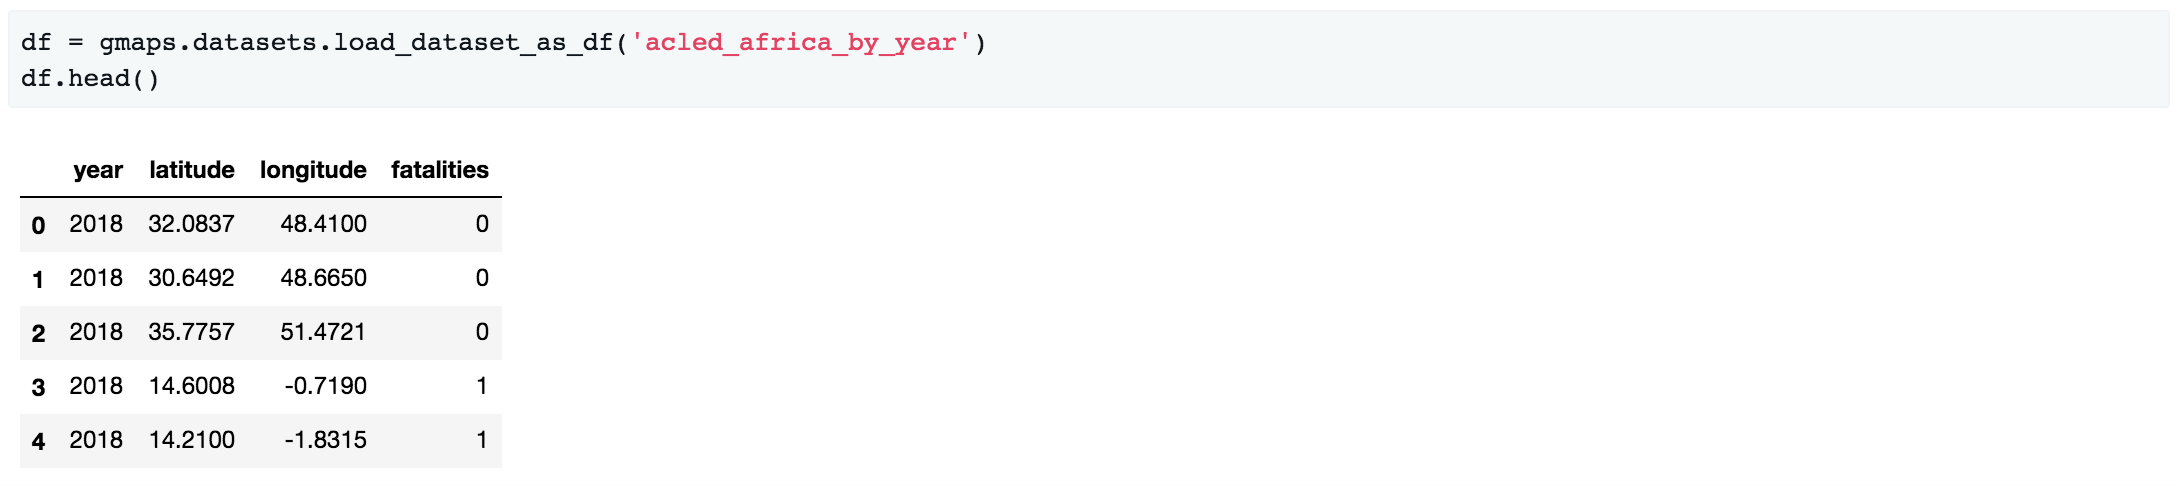
As an example, we will use the acled_africa_by_year dataset, a dataset
indexing violence against civilians in Africa. The original dataset is from the
ACLED project. The dataset has four
columns:
import gmaps.datasets

df = gmaps.datasets.load_dataset_as_df('acled_africa_by_year')
df.head()
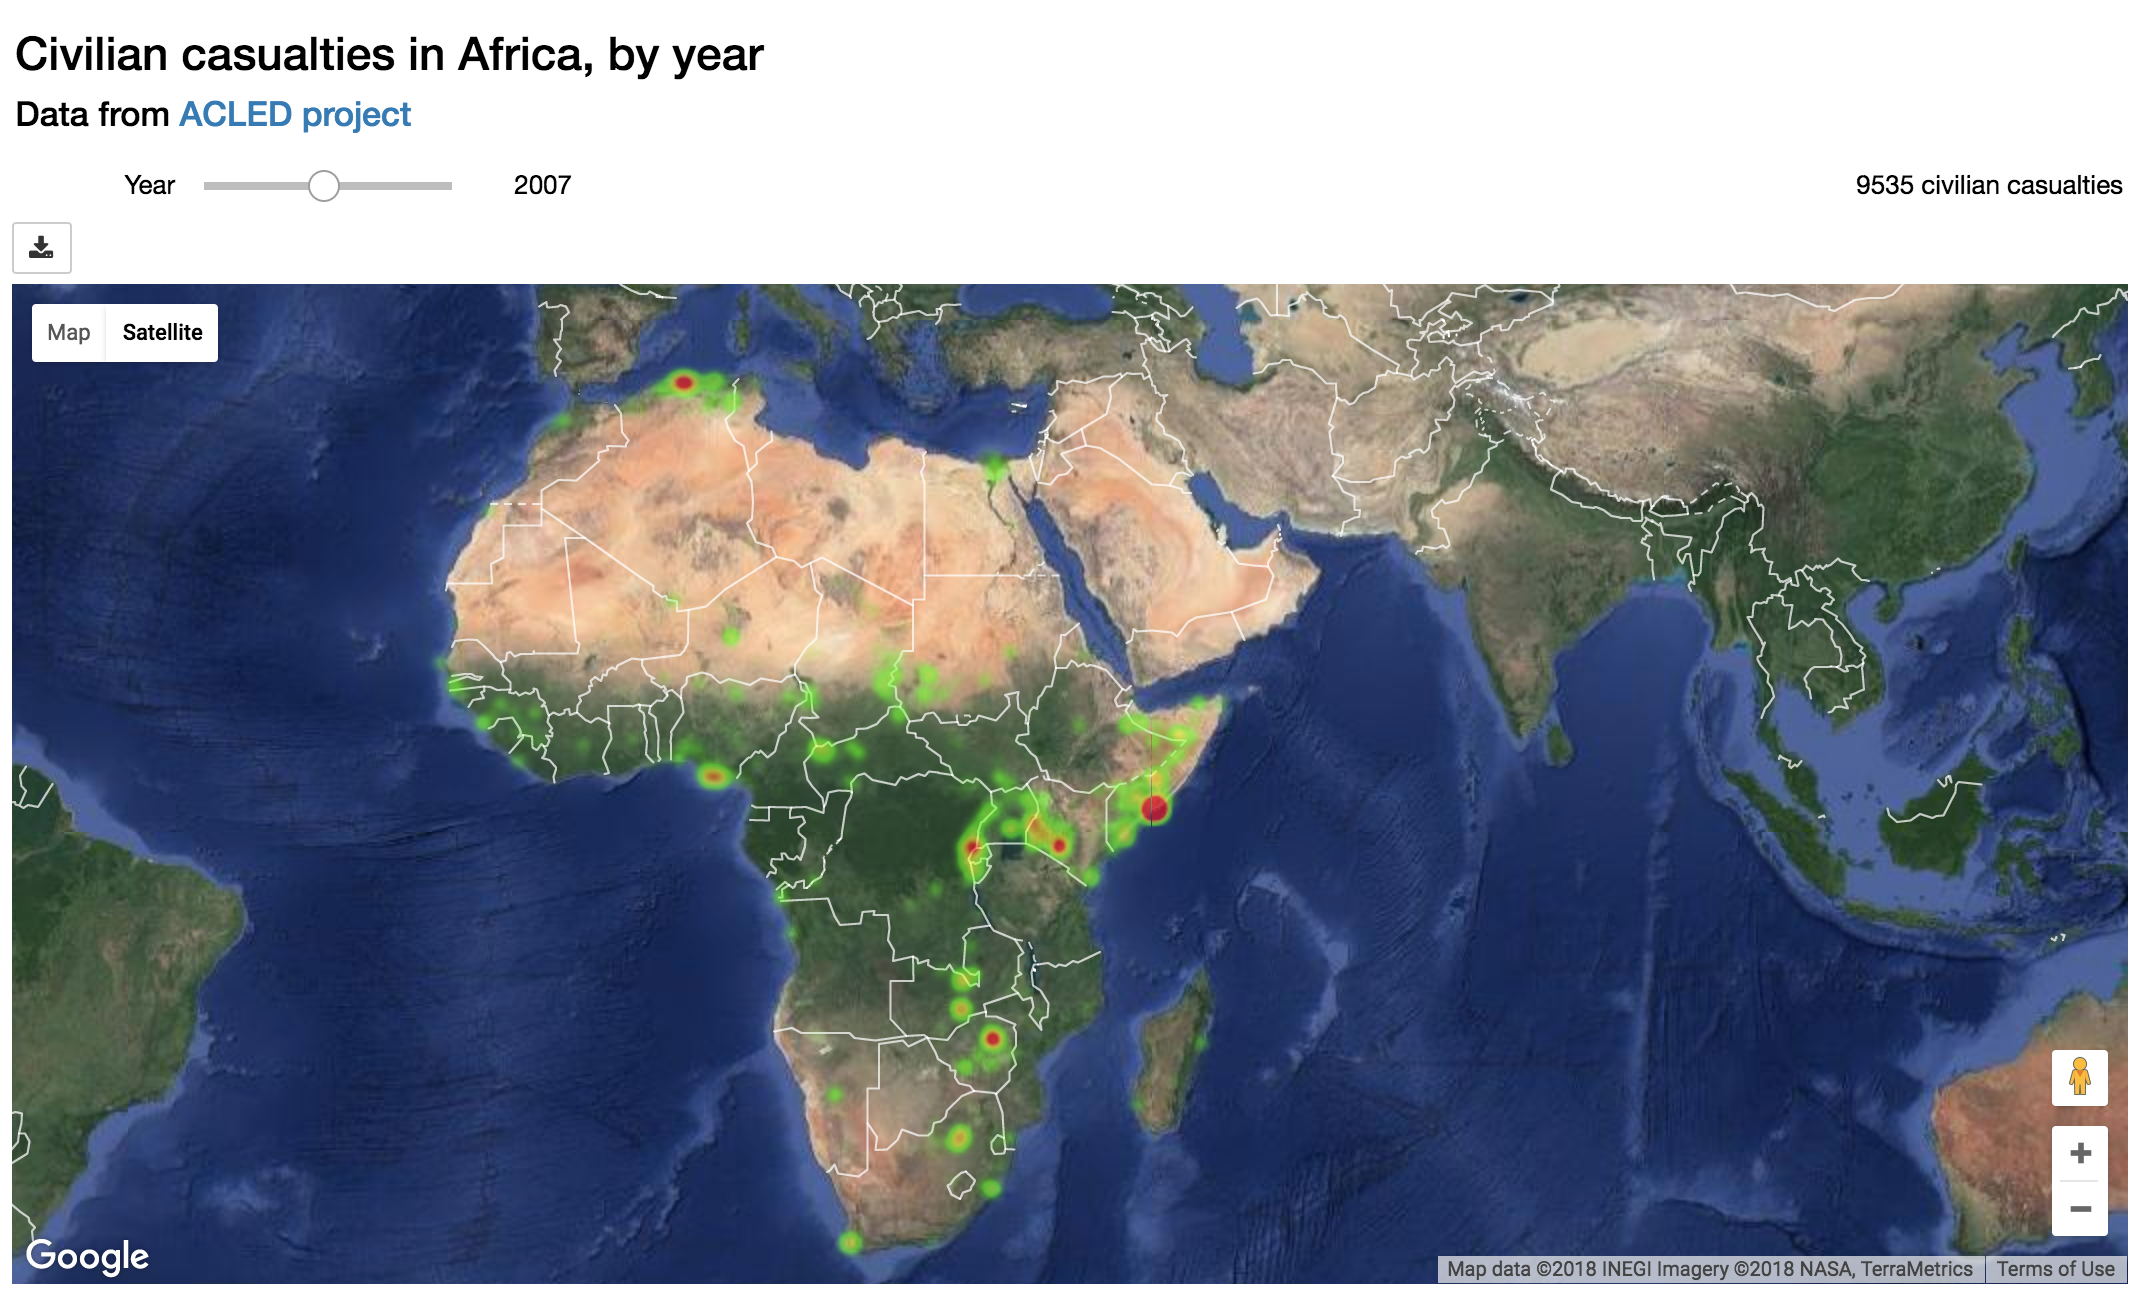
We will build an application that lets the user explore different years via a slider. When the user changes the slider, we display the total number of fatalities for that year, and update a heatmap showing the distribution of conflicts.
This is the entire code listing:
from IPython.display import display
import ipywidgets as widgets

import gmaps
gmaps.configure(api_key='AIza...')


class AcledExplorer(object):
    """
    Jupyter widget for exploring the ACLED dataset.

    The user uses the slider to choose a year. This renders
    a heatmap of civilian victims in that year.
    """

    def __init__(self, df):
        self._df = df
        self._heatmap = None
        self._slider = None
        initial_year = min(self._df['year'])

        title_widget = widgets.HTML(
            '<h3>Civilian casualties in Africa, by year</h3>'
            '<h4>Data from <a href="https://www.acleddata.com/">ACLED project</a></h4>'
        )

        map_figure = self._render_map(initial_year)
        controls = self._render_controls(initial_year)
        self._container = widgets.VBox([title_widget, controls, map_figure])

    def render(self):
        display(self._container)

    def _on_year_change(self, change):
        year = self._slider.value
        self._heatmap.locations = self._locations_for_year(year)
        self._total_box.value = self._total_casualties_text_for_year(year)
        return self._container

    def _render_map(self, initial_year):
        fig = gmaps.figure(map_type='HYBRID')
        self._heatmap = gmaps.heatmap_layer(
            self._locations_for_year(initial_year),
            max_intensity=100,
            point_radius=8
        )
        fig.add_layer(self._heatmap)
        return fig

    def _render_controls(self, initial_year):
        self._slider = widgets.IntSlider(
            value=initial_year,
            min=min(self._df['year']),
            max=max(self._df['year']),
            description='Year',
            continuous_update=False
        )
        self._total_box = widgets.Label(
            value=self._total_casualties_text_for_year(initial_year)
        )
        self._slider.observe(self._on_year_change, names='value')
        controls = widgets.HBox(
            [self._slider, self._total_box],
            layout={'justify_content': 'space-between'}
        )
        return controls

    def _locations_for_year(self, year):
        return self._df[self._df['year'] == year][['latitude', 'longitude']]

    def _total_casualties_for_year(self, year):
        return int(self._df[self._df['year'] == year]['year'].count())

    def _total_casualties_text_for_year(self, year):
        return '{} civilian casualties'.format(self._total_casualties_for_year(year))


AcledExplorer(df).render()
There are several things to note on this:
- We wrap the application in a class to help keep the mutable state encapsulated.
- As part of the class constructor, we use
gmaps.figure()to create a figure. We add usegmaps.heatmap_layer()to create a heatmap, which we add to the figure. TheHeatmapobject returned has alocationsattribute. Setting this to a new value will automatically update the heatmap. - We create a slider with
widgets.IntSlider. In general, jupyter-gmaps objects are designed to interact with widgets from ipywidgets. For a full list of available widgets, see the ipywidgets documentation. - We want to react to changes in the slider: every time the slider moves, we
recompute the total number of fatalities and update the data in the heatmap.
To react to changes in a widget, we use the
.observemethod on the widget. This lets us specify a callback that gets called whenever a given attribute of the widget changes. We pass thenames="value"argument toslider.observeto only react to changes in the slider’svalueattribute. Note that the callback (self.renderin our case) needs to take a single argument. It gets passed a dictionary describing the change. - To build the layout for our application, we use combinations of HBox and VBox widgets.
Updating symbols in response to other widgets
The marker and symbol layers can also be udpated dynamically (as can most other markers).
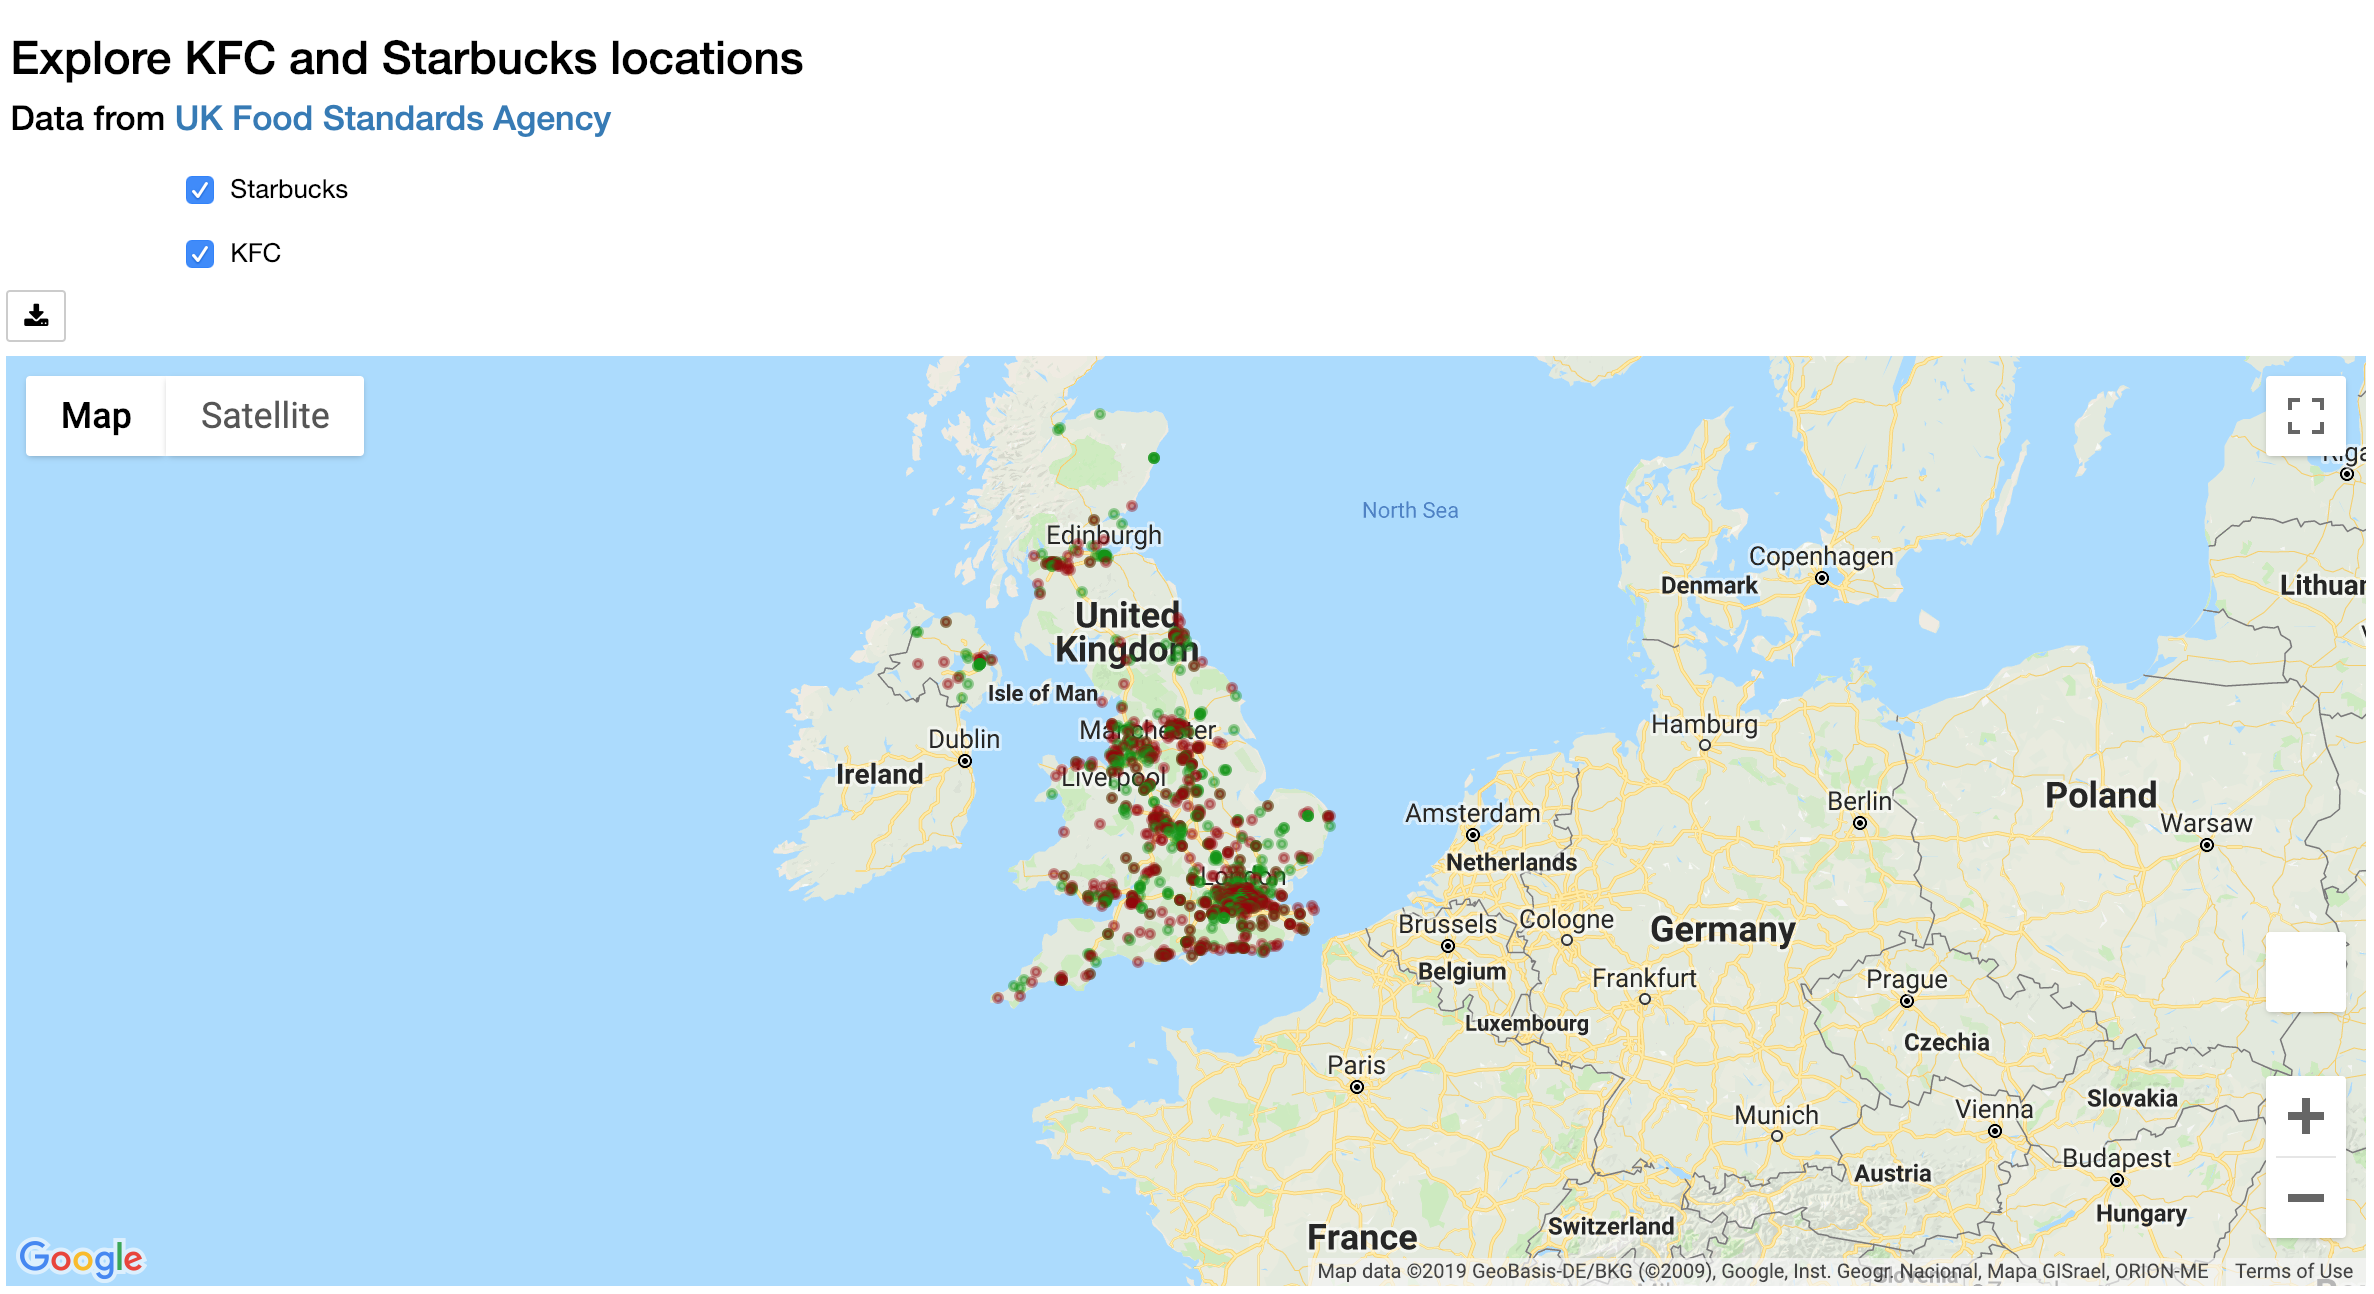
As an example, we will use the starbucks_kfc_uk dataset, a dataset
indexing the location of every Starbucks and KFC in the UK. The
original dataset is from the
UK food standards agency.
We will build a application with two checkboxes, one for Starbucks outlets and one for KFC outlets. We react to users clicking on the outlets by changing the symbols displayed on the map.
This is the entire code listing:
from IPython.display import display
import ipywidgets as widgets

import gmaps
import gmaps.datasets
gmaps.configure(api_key="AIza...")


class OutletExplorer(object):

  def __init__(self, df):
      """
      Jupyter widget for exploring KFC and Starbucks outlets

      Using checkboxes, the user chooses whether to include
      Starbucks, KFC outlets, both or neither.
      """
      self._df = df
      self._symbol_layer = None

      self._starbucks_symbols = self._create_symbols_for_chain(
          'starbucks', 'rgba(0, 150, 0, 0.4)')
      self._kfc_symbols = self._create_symbols_for_chain(
          'kfc', 'rgba(150, 0, 0, 0.4)')

      title_widget = widgets.HTML(
          '<h3>Explore KFC and Starbucks locations</h3>'
          '<h4>Data from <a href="http://ratings.food.gov.uk">UK Food Standards Agency</a></h4>'
      )
      controls = self._render_controls(True, True)
      map_figure = self._render_map(True, True)
      self._container = widgets.VBox(
          [title_widget, controls, map_figure])

  def render(self):
      """ Render the widget """
      display(self._container)

  def _render_map(self, initial_include_starbucks, initial_include_kfc):
      """ Render the initial map """
      fig = gmaps.figure(layout={'height': '500px'})
      symbols = self._generate_symbols(True, True)
      self._symbol_layer = gmaps.Markers(markers=symbols)
      fig.add_layer(self._symbol_layer)
      return fig

  def _render_controls(
      self,
      initial_include_starbucks,
      initial_include_kfc
  ):
      """ Render the checkboxes """
      self._starbucks_checkbox = widgets.Checkbox(
          value=initial_include_starbucks,
          description='Starbucks'
      )
      self._kfc_checkbox = widgets.Checkbox(
          value=initial_include_kfc,
          description='KFC'
      )
      self._starbucks_checkbox.observe(
          self._on_controls_change, names='value')
      self._kfc_checkbox.observe(
          self._on_controls_change, names='value')
      controls = widgets.VBox(
          [self._starbucks_checkbox, self._kfc_checkbox])
      return controls

  def _on_controls_change(self, obj):
      """
      Called when the checkboxes change

      This method builds the list of symbols to include on the map,
      based on the current checkbox values. It then updates the
      symbol layer with the new symbol list.
      """
      include_starbucks = self._starbucks_checkbox.value
      include_kfc = self._kfc_checkbox.value
      symbols = self._generate_symbols(
          include_starbucks, include_kfc)
      # Update the layer with the new symbols:
      self._symbol_layer.markers = symbols

  def _generate_symbols(self, include_starbucks, include_kfc):
      """ Generate the list of symbols to includs """
      symbols = []
      if include_starbucks:
          symbols.extend(self._starbucks_symbols)
      if include_kfc:
          symbols.extend(self._kfc_symbols)
      return symbols

  def _create_symbols_for_chain(self, chain, color):
      chain_df = self._df[self._df['chain_name'] == chain]
      symbols = [
          gmaps.Symbol(
              location=(latitude, longitude),
              stroke_color=color,
              fill_color=color,
              scale=2
          )
          for latitude, longitude in
          zip(chain_df["latitude"], chain_df["longitude"])
      ]
      return symbols


df = gmaps.datasets.load_dataset_as_df("starbucks_kfc_uk")
OutletExplorer(df).render()
We used the gmaps.Markers class to represent the symbol layer,
rather than the gmaps.symbol_layer() factory function. The
Markers class is easier to manipulate, since it just takes a list
of symbols. The disadvantage is that we had to construct the symbols
independently.